
Hello authors! We've got something special to help enhance your online presence. Introducing our free downloadable image safe zone templates for Instagram Reels and TikTok! Why Use Safe Zone Templates? As an author, it's essential to create eye-catching visuals that resonate with your readers and fans. Safe zone templates provide a handy guide to ensure your images align perfectly on different screen sizes and devices. By using these templates, you can be confident that your graphics will grab attention and look professional. Download and Customize Ready to make your visuals stand out on Instagram Reels and TikTok? We've provided two easy-to-use downloadable templates: 1. Instagram Reels Safe Zone Template: Download Here 2. TikTok Safe Zone Template: Download Here How to Use the Templates 1. Download the preferred safe zone template file. 2. Open your favorite design software or app. 3. Import the template as a separate layer or overlay. 4. Customize your image within the designated safe zone, ensuring important elements are within it. 5. Once you're satisfied, remove the template layer and save/export your file.

I can’t help myself. Every time I meet a happy couple, I need to know how they met. The stories are always so different and so fascinating! You probably have at least one great meet-cute story in your family, circle of friends, or in your community. But why is it a truly terrible idea to take the love story of someone you know and turn that into a romance novel? Can’t I just call my grandma by a different name, change up the facts a little, and write up a romance novel that honors my family’s story? Well, you shouldn’t. And here’s why.
I wanted to share a beginner template for logging Kindle Vella performance and planning out a series in a google sheet. It's 100% free and I use it with several authors. If you'd like to share feedback to improve the sheet for new authors feel free to reach out to me.
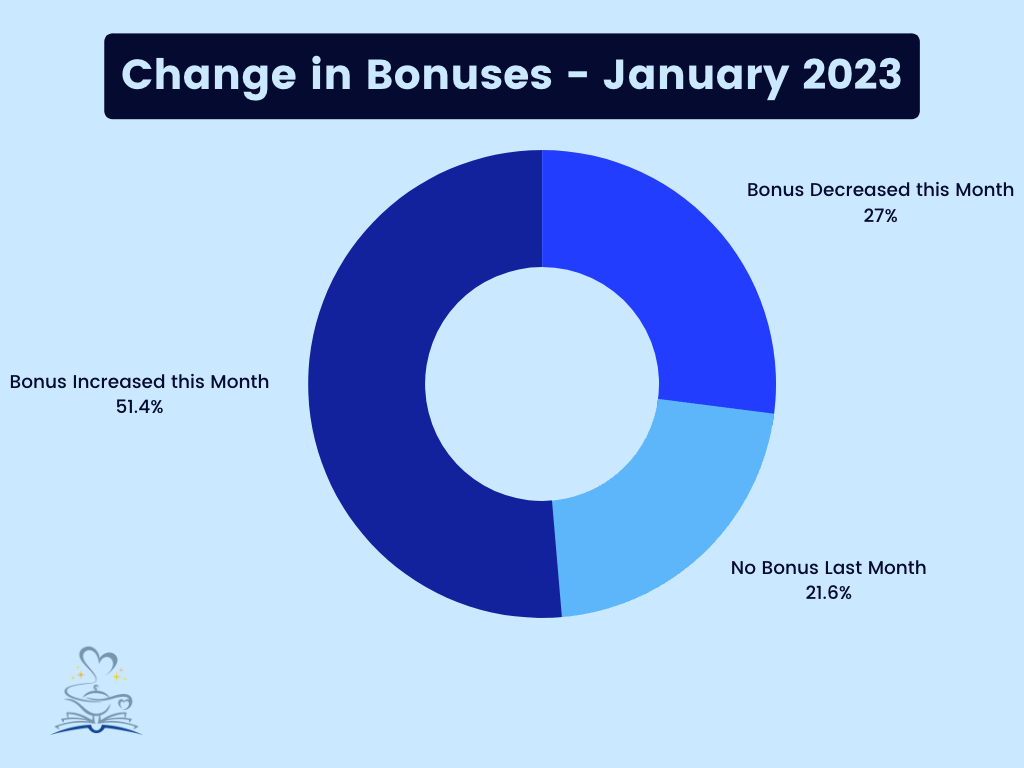
This month, our analysis of the correlations between the independent variables and bonus for the month of January 2023 has revealed some interesting insights. While typically we would focus on the differences in correlations to determine the overall impact of each independent variable, this month has shown that the top three variables remain closely correlated. However, what is particularly noteworthy this month is the continued strong relationship between bonuses under $5000 and under $1000. In previous months we've found the strength of these relationships to dip quite dramatically. For example this could indicate a few things from algorithmic changes to the weightings of each variable with a greater weighting on Episode Unlocks (Free and Paid) along with Royalties. It could also indicate a decrease in platform engagement rates.
Disclaimer The data I'll be referring to was manually submitted anonymously by Kindle Vella Authors and as such we can make no warranty or guarantee regarding the correctness or authenticity of the data. You can read the full disclaimer regarding the data available here: https://www.book-genie.com/kindle-vella-bonus-breakdown . Readers should note that these are informal calculations gathered by unvalidated third party submissions. None of the authors, contributors, administrators, owners, or anyone else connected with Book Genie, in any way whatsoever, can be responsible or liable for your use, reliance, or distribution of the information. NOTE: Amazon has the authority to change the weighting of each variable at any point in time. Our findings shouldn't be considered outside the month measured. (December 2022)

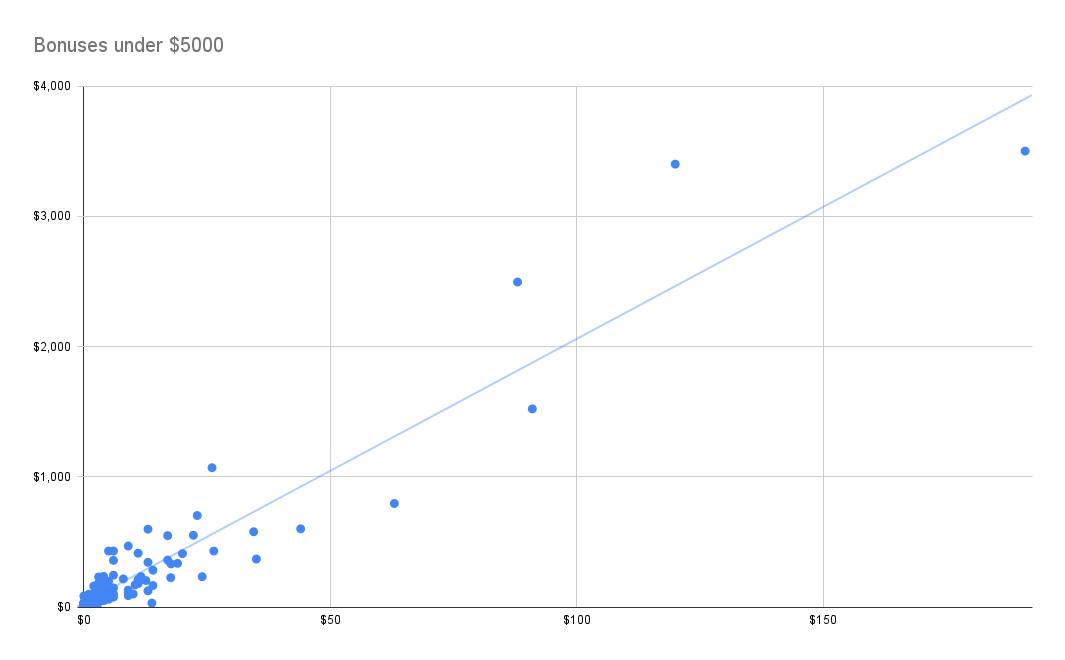
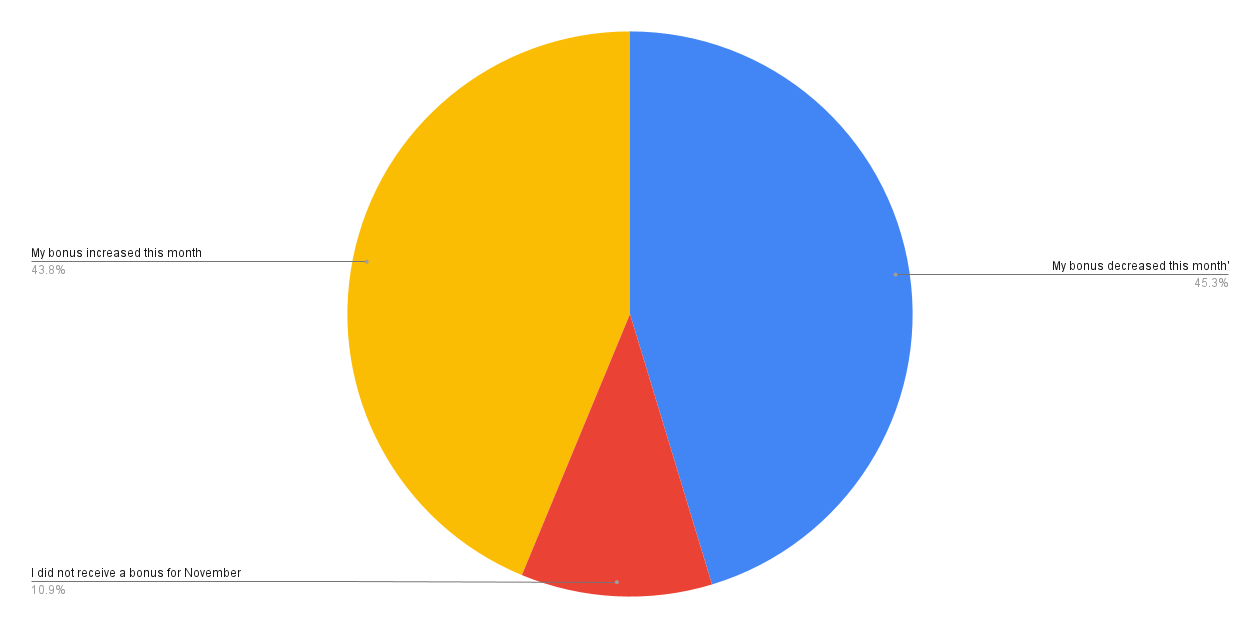
Hey Everyone, I wanted to update you all on my findings from the survey I took around the November Kindle Vella Bonus. Disclaimer The data I'll be referring to was manually submitted anonymously by over 100 Kindle Vella Authors and as such we can make no warranty or guarantee regarding the correctness or authenticity of the data. You can read the full disclaimer regarding the data available here: https://www.book-genie.com/kindle-vella-bonus-breakdown . Readers should note that these are informal calculations gathered by unvalidated third party submissions. None of the authors, contributors, administrators, owners, or anyone else connected with Book Genie, in any way whatsoever, can be responsible or liable for your use, reliance, or distribution of the information. During the survey I asked Authors to report their results for each each series individually. The following list are metrics I focused on for this month: “Bonus” - The bonus earned for a single series as reported in the Vella Dashboard “Top 250 Faved Rank” - If the same series ranked in the Top 250 Faved at month end its position was recorded. Series that didn’t rank were marked with a “Did not rank” tag “Royalties Earned” - The total royalties accrued for the month. Due to Amazon’s rounding in the dashboard, the results may be rounded to the nearest dollar. “Total Episodes Unlocked” - The total episodes unlocked for the series in the month of November as reported in the Vella Dashboard “Paid Episodes Unlocked" - The paid episodes unlocked for the series in the month of November as reported in the Vella Dashboard “Episodes Released in November” - The published episodes released in November. Completed series were marked as 0. “Gained Followers” - An estimation of gained followers in November (Bucketed into groups of 50) - Followers was a hard metric for authors to accurately measure as Amazon does not show historical data in the Vella dashboard and so will be excluded from this and future surveys. For the same reason series likes is difficult to accurately report on at scale. When analyzing the bonus it is important to remember that authors are paid from a finite pool each month. This means that the sum of all authors bonuses cannot exceed the total bonus pool announced for the given month. For example in the case of November the bonus pool was $1,000,000. Adding up every bonus that the authors received in November would therefore give you $1,000,000. Since the bonus pool is finite each author’s bonus would therefore be relative to the bonuses of all authors on the platform for the given month. In short your bonus earnings aren't just dictated by your performance, but compared to the performance of all other authors on the platform. This means there is no single formula that can be consistently used month on month to accurately predict your bonus. Monthly fluctuations can be influenced by both your performance and the performance of every other author on the platform. Changes in the average author’s performance, an increase in the number of series on the platform, and changes to the bonus pool can impact your bonus. It should also be noted that episodes unlocked with free tokens are compensated within the bonus. However, we cannot accurately separate these earnings from the bonus. We can look at each variable (e.g. Paid Episode Unlocks) that has been publicly stated by Amazon to impact the bonus and look at its individual relationship (Correlation) to the bonus to predict the weighting of each variable. NOTE: Amazon has the authority to change the weighting of each variable at any point in time. Meaning our findings shouldn't be considered outside the month measured. (November 2022) The correlation coefficient which I have used to compare each variable against bonus earnings is defined as a statistical measure of the strength of a linear relationship between two variables. Its values can range from -1 to 1. Indicating at -1 a perfect negative correlation and at 1 a direct positive correlation, with 0 indicating no correlation. Simplified for the non-mathsy the closer to 1 the coefficient is the greater the relationship between that variable and the bonus. The closer to 0 the weaker the relationship. For the statisticians reading I understand that there are other models we could use. However, given the time taken to reach out, compile, and write up this post I've opted to focus on correlation. In addition, based on the size of the data I was working with, I determined correlation coefficients were the most practical starting point. My first experiment was to measure the correlation coefficient between the Bonus authors recorded against every other variable. For the first round to help paint a clearer picture I left significant outliers (Bonuses that were abnormally distant from the rest) in. As such these results were heavily influenced by a small set of bonuses. (Reminder: The closer to 1.000 the stronger the relationship to the bonus the closer to 0.000 the weaker the relationship.) Royalties Earned: 0.994 Paid Episodes Unlocked: 0.987 Total Episodes Unlocked: 0.984 Episodes Published: 0.015 At this point I decided to remove bonuses larger than $5000 to have a clearer sense of the weightings for the majority of submitters. With bonuses under $5000 the correlation coefficients were as follows Royalties Earned: 0.890 Total Episodes Unlocked: 0.535 Paid Episodes Unlocked: 0.525 Episodes Published: 0.159 In this test Royalties had the strongest correlation of all metrics. This trend continued for bonuses under $1000 where the correlation coefficients were as follows. Royalties Earned: 0.631 Total Episodes Unlocked: 0.24 Paid Episodes Unlocked: 0.216 Episodes Published: 0.160 I’ve included the scattergraphs comparing bonuses “Y Axis” under $5000 & $1000 respectively against royalties “X Axis”
If you write multiple series please submit them individually. Once submitted refresh the page to reset the form

The data logged in this article was manually gathered [March 1st, 2022] from the Kindle Vella Top 250 Faved list from information publicly available at the time this article was written. Please be advised the data and insights provided are the opinions of Book Genie. We make no warranty or guarantee regarding the correctness or authenticity of the data, as these are informal calculations gathered via our independent research and is in no way affiliated with or should be construed to represent Amazon, Kindle Vella, or any other Amazon entity. None of the authors, contributors, administrators, owners, or anyone else connected with Book Genie, in any way whatsoever, can be responsible or liable for your use, reliance, or distribution of the information contained in or linked from these web pages. We respectfully remind readers that we assume no responsibility or liability for any errors or omissions in the content of this data. The information contained here is provided for general informational purposes only on an "as is" basis with no guarantees of completeness, accuracy, usefulness or timeliness. Percentages listed may be rounded.